 The Refutation
The graveyard · The autopsy
Overbought Is Not a Sell Signal
Open any charting app and one of the first indicators it hands you is the RSI, the Relative Strength Index, with two lines already drawn at 70 and 30. The rule is taught as gospel: above 70 the market is "overbought" and due to fall, below 30 it is "oversold" and due to bounce. It is on every screen and in every introduction-to-charting course, and it has a tidy physical story, that price is a stretched rubber band and RSI tells you when it is about to snap back. We wanted it to be true. We tested it the simplest and hardest way we could, and it isn't.
Rather than build a strategy full of stops and targets to argue about, we asked the one question the myth actually makes a claim about: once RSI crosses into the zone, which way does price go, and how far? If "oversold" means anything, price should rise afterward. If "overbought" means anything, price should fall. So we measured exactly that. First, though, a picture of what "oversold" looks like in the wild.
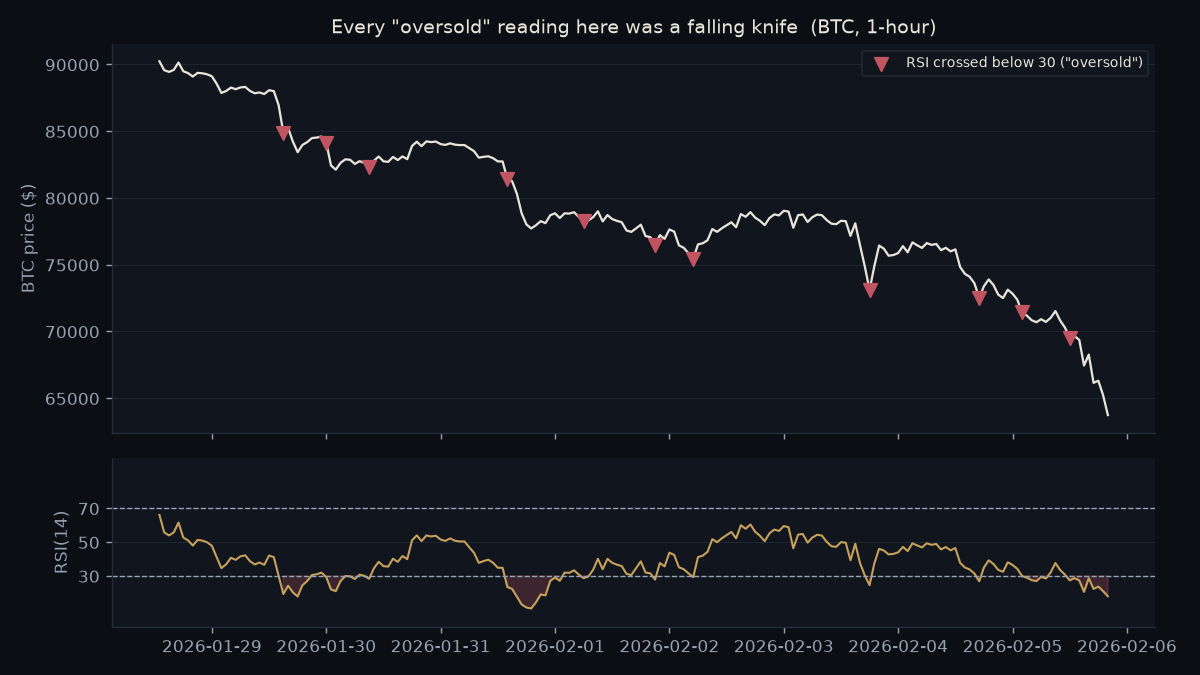
That is one window in time, and one window proves nothing. So we did it everywhere.
The test: how far does price actually travel?
We took every RSI cross into overbought (above 70) and into oversold (below 30), on six chart timeframes from 5 minutes to 4 hours, pooled across Bitcoin, Ethereum, Solana and XRP, and measured the average price move over the next 1, 2, 3, 5, 10 and 20 bars (i.e. on a 120m chart: 1 bar = 120 mins). Tens of thousands of signals. If the myth holds, the oversold grid should glow green (price rose) and the overbought grid red (price fell).
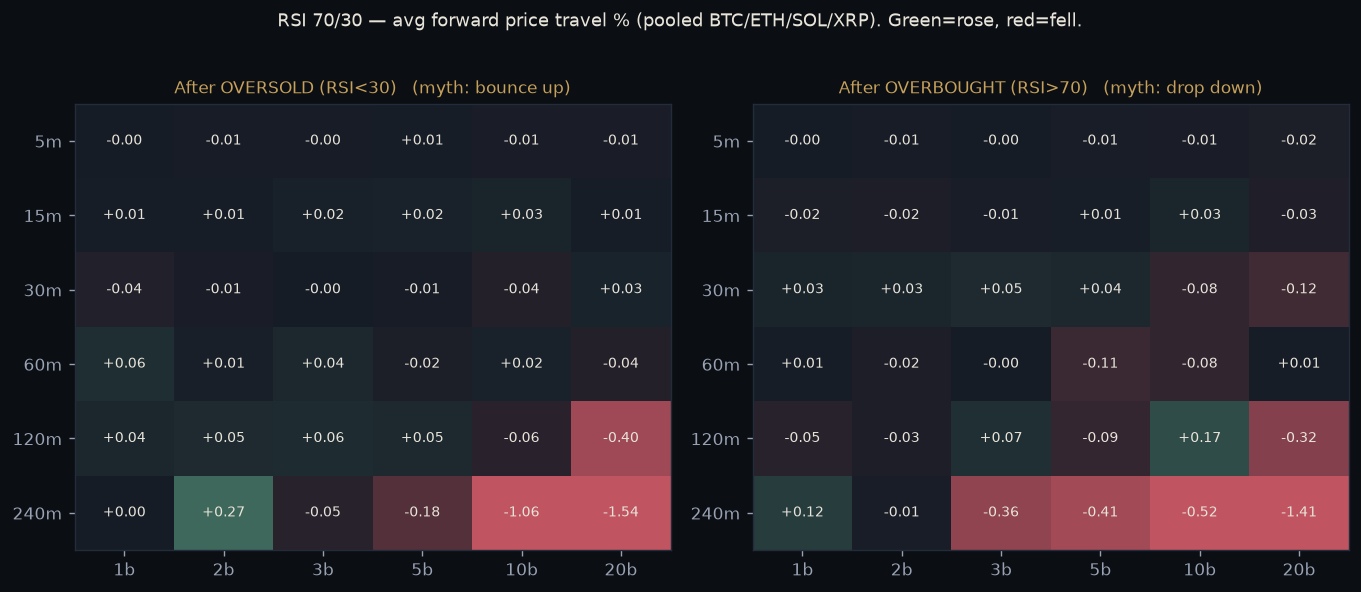
Read the numbers and the myth simply isn't there. On the 5-minute chart, after nearly eight thousand signals, the average forward move is 0.00% in every column, both directions. Price does not bounce and it does not drop. It continues. The rule demands a reversal, and what actually happens is nothing, or more of the move that was already underway.
Where it isn't nothing, it's backwards
The few cells with real colour point the wrong way. After "oversold" on the 4-hour chart, price falls a further 1.06% over the next ten bars and 1.54% over twenty. That is Figure 1 at scale: in a downtrend, oversold readings cluster on the way down, and buying them means catching every leg lower. On the middle timeframes the overbought side leans wrong too, with price drifting up after "overbought," because a strong uptrend keeps its RSI above 70 for days. The old trading-desk line is the honest one. Overbought can stay overbought, and oversold can stay oversold, far longer than the rule pretends.
The objections, answered
- "You have to use a stop and a target." A stop and a target shape a strategy's risk, but they cannot manufacture a forecast out of a signal whose average forward move is zero. If the direction isn't there, no exit rule adds it; you are just paying fees to trade noise.
- "You need confirmation, or divergence." That is a different signal, and we have put that family through the same gauntlet; it fared no better. In any case, "RSI over 70 means sell" is the claim printed on every chart, and that is the claim we are refuting.
- "It works in a range." An oscillator will always look right in a market that was already oscillating, which is circular. The test that matters is whether it predicts across conditions it was not chosen for, and pooled over four assets and six timeframes, it does not.
We built the strategy anyway, and ran it through the wall
The forward-travel test needs no strategy, which is its strength, but some readers will believe only a full one with a stop and a target. So we built it: buy every oversold cross, short every overbought cross, and let the backtest pick the best stop and take-profit. Then we ran it through the test we trust most, leave-one-regime-out. Fit the settings on five distinct market eras, score them on a sixth the strategy has never seen, and rotate so every era takes its turn as the unseen one; a real edge survives the era it was not tuned on.
It passed zero of six regimes on every timeframe from 5 minutes to 4 hours. And on each one, the tuner could not even find a stop and target that held up across the five training eras, let alone the unseen sixth. That is not "it lost." It is the machine reporting that there is nothing there to fit, at any speed.
Why it fails
RSI is a bounded number. By construction it can only sit between 0 and 100, so it always looks like it is "at an extreme" the moment a move gets going. But bounded is not the same as mean-reverting. A thermometer reading 40 degrees is also at an extreme; that does not mean it will begin reverting to a mean value. RSI measures how one-sided recent trading has been, and a market that is trending is, by definition, one-sided. So the indicator raises its flag exactly when the trend is strongest, which is the worst possible moment to bet against it.
The verdict
"Overbought" and "oversold" are two of the most repeated words in trading, and they describe the past, not the future. Across four assets, six timeframes and every horizon we checked, an RSI reading above 70 or below 30 tells you nothing tradeable about where price goes next, and on the slower charts it points the wrong way. It is not a signal. It is a label for a move that has already happened, wearing the costume of a forecast.
That is the job of this letter: to tell you which famous things are real and which are only famous. RSI 70/30 is only famous.
Access The Survivors, the strategies that do hold up, for about the cost of a month's brokerage.
How this was tested (so you can trust the numbers)
BTC, ETH, SOL and XRP 1-minute data resampled to each timeframe · the signal is the bar on which RSI(14) crosses above 70 or below 30 · we measure the raw forward return over the next N bars, pooled across all four assets · the honest yardstick is the unconditional forward return of an average bar over the same N bars, and on the timeframes with real sample size the difference from it is indistinguishable from zero · forward windows can overlap when signals cluster, which inflates apparent significance, so we read the near-zero average and its sign rather than a single t-statistic · no strategy, stops or targets are involved, by design, so the measurement reflects the signal's raw predictive content before any trading rule could obscure it · the tradeable form (long the oversold cross, short the overbought cross, stop and take-profit fitted per fold) was also run through leave-one-regime-out across a six-era regime library on BTC/ETH/BNB, and it passed zero of six on every timeframe.