 The Refutation
The graveyard · The autopsy
We tested the 50/100 MA ribbon 55 different ways over five years
The pitch you've seen a hundred times
Move like the wind, be still as the mountain, the old strategists taught. The moving-average ribbon promises to tell you which moment you're in. The catch: it's built from the past, so the wind it reads has already blown.
Stack a fan of moving averages on a chart and assign colours to them. Wait for the bands to fan out and align, and price is "in a trend." When the lines compress and the colours flip, the trend is "turning," so you trade the flip. It looks like structure. The ribbon expands and contracts, it breathes, and your eye insists that breathing is tradable.
So we tested it. Not one version in fifty-five configurations survived.
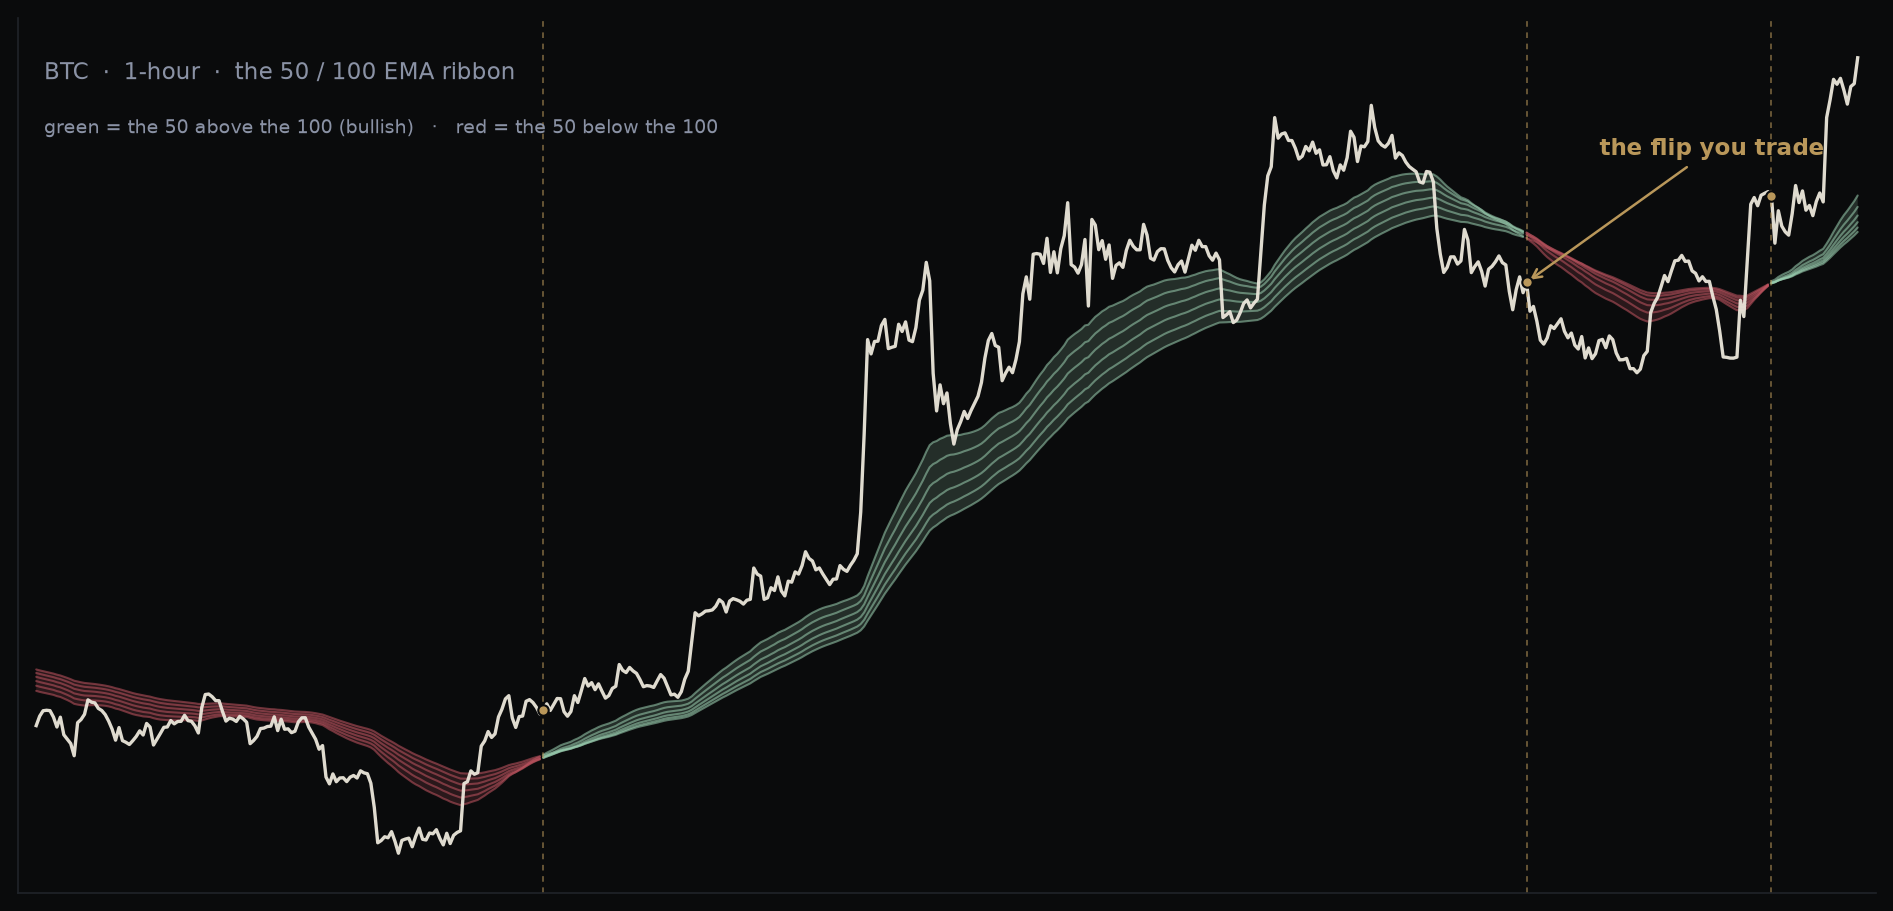
The idea is simple enough to see on a chart. Figure 1 shows the ribbon on Bitcoin's hourly chart: a band of moving averages that reads green while the faster ones sit above the slower ones and red once they cross below. Every time the colour flips, that is the trade. What the eye reads as a clean call on the trend is really a lagging average of prices that have already printed, which is the first clue to why this might not be a promising use of your money.
The method
We took the popular EMA colour-flip, built on the 50 and 100-period averages, and ran it on more than five years of one-minute BTC and ETH data, February 2021 to July 2026, as a grid of 55 configurations: three strictness variants for what counts as a "flip," two exit modes (pure stop-and-reverse versus flat-on-neutral), and a spread of timeframes. That last axis is two knobs at once: the execution timeframe, the chart speed you place the trade on, and the band timeframe, the chart speed the ribbon itself is measured on. A common setup reads the ribbon on a slower chart than it trades on, so we tested combinations of both. Entry on a bar-close flip, filled at the next bar's open, so there is no look-ahead and no filling at the close you just watched print. One position at a time, so a cluster of "the ribbon just flipped!" bars cannot be counted as ten independent wins.
The cost that decides this is the taker fee we pay to cross the spread every time we flip, about 0.055% a side, netted on every trade. For a rule that trades this often, that fee is the first-order cost, and on its own it is enough to sink every version. Perpetual funding is a smaller, sign-varying term we did not model, sometimes a debit and sometimes a credit depending on which way you are positioned, and it is not what settles the question. A round-trip that costs real money changes the maths of any strategy that trades a lot, and the ribbon flip is no exception.
What the data actually showed
Every single one of the 55 configurations finished with a negative total return once fees were factored in. Not "modest." Not "needs tuning." Just plain old red.
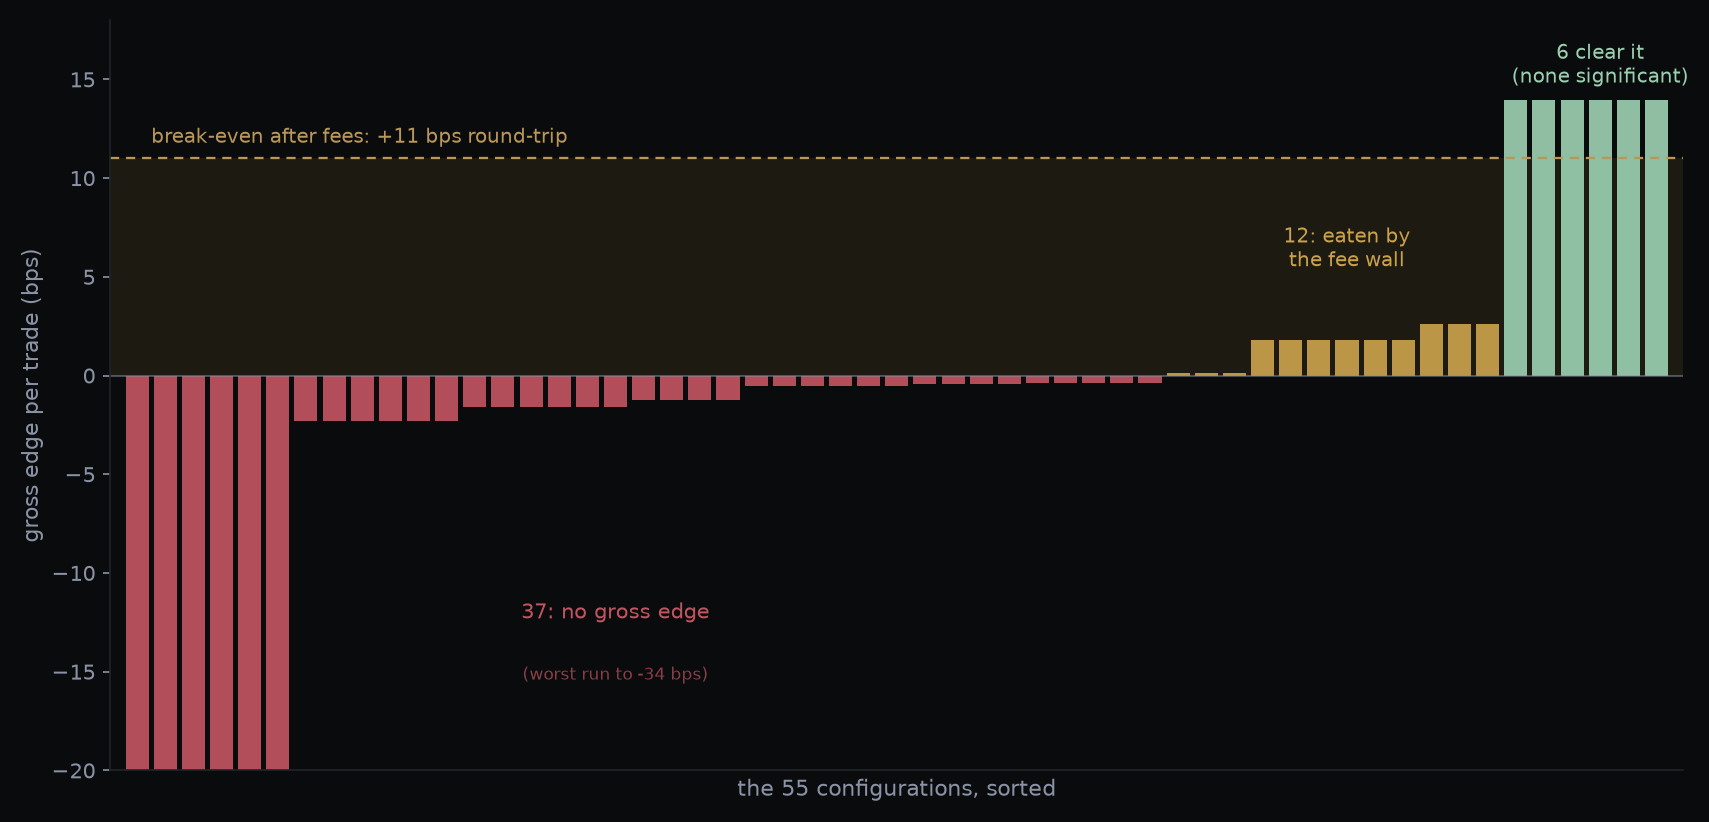
If we break down where the losses came from, it splits two ways. 37 of the 55 were gross-negative before fees: pure noise, entries with no directional edge at all. Another twelve were fee-wall casualties, gross-positive but net-negative, an edge too thin to survive the cost of trading it. Six of the 55 squeaked out a marginally positive net edge per trade, but zero of the 55 were statistically significant. The best cell in the entire grid still lost about 10% of the account, with a t-stat of about 0.1, which is the statistical signature of noise.
That two-way split is Figure 2. A round trip on these fees costs about 11 basis points, so an entry has to clear an 11-basis-point gross edge just to break even, and almost nothing does.
Two things about the mechanics are worth pinning down, because they are the opposite of what the ribbon is sold on.
The win-rate (WR) is low, not high. Across the grid, WR sat around 14 to 29%. The colour-flip is a whipsaw machine: it flips you long near the top of a wiggle and flat or reversed near the bottom, over and over, and only a rare clean trend pays off. The few wins never come close to paying for the steady drip of whipsaw losses and fees in between. This matters because the ribbon is usually sold on the feeling of "catching the big move," when the day-to-day reality of the rule is a low hit-rate grind.
A natural objection lands right here: why not add a cooldown between flips to sit out the chop? We did not test an explicit timer, but the strictest of our three flip settings already does the same job, refusing to act until all three of the ribbon's trend votes agree, and it changed nothing. A cooldown thins the number of trades, not their direction; it can only make a rule with no edge bleed more slowly, and 37 of the 55 had no gross edge at all before a single fee, which is nothing for patience to rescue.
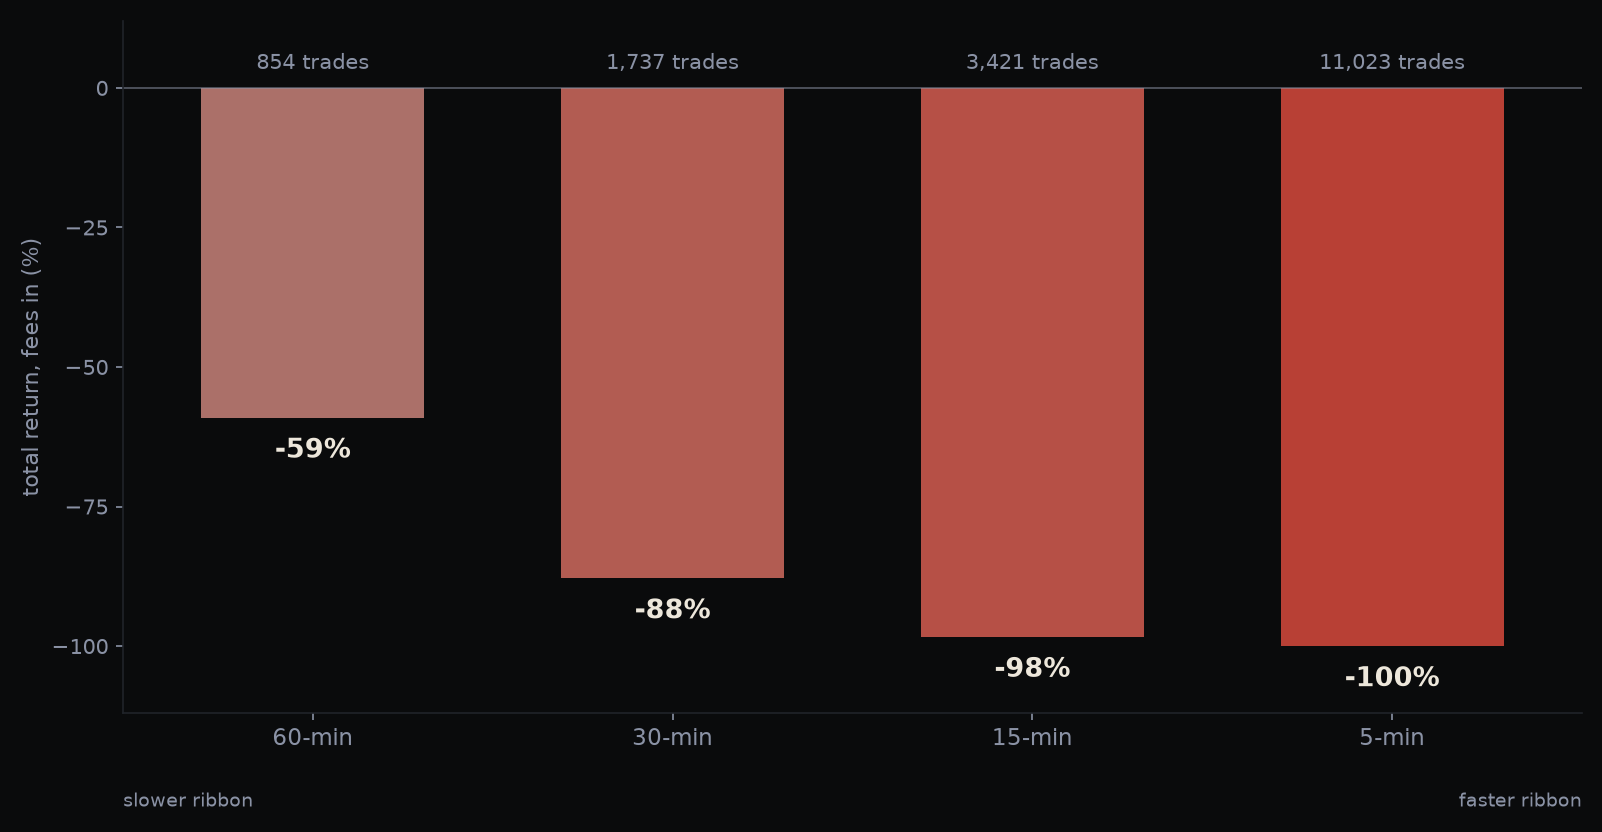
Faster is worse, without exception. Speed the ribbon up and you add trades, and every trade pays the exchange fee again. On a pure stop-and-reverse system the total return degrades in lockstep with the churn: 60-minute lost 59% over 854 trades, 30-minute lost 88% over 1,737 trades, 15-minute lost 98% over 3,421 trades, and the 5-minute version churned roughly 11,000 trades straight into a 100% loss. There's no timeframe where the churn stops chipping away at the account. The only difference is how fast it decays.
The honest takeaway
The moving-average ribbon is a visualisation, and a decent one. It compresses a lot of price information into something the eye reads fast, and has value in itself.
On the timeframe you execute, a bar-close flip is describing a wiggle that already happened, and it hands you a low win-rate that the occasional winner never earns back net of fees. More moving averages did not mean more signal. Fifty-five ways of dressing up the same flip all arrived at the same place: negative, and more negative, the more they traded.
This isn't a claim that no moving-average logic can ever work. Plenty of trend concepts are worth testing, and we test them all. It is a plain report on one specific popular family: the ribbon colour-flip, run honestly across 55 configurations, went 0 for 55.
And that's the point of the graveyard. Most of what looks like structure is a flattering picture painted over a fee-bleeding engine. We publish the rare survivors to our premium members.
Education and data-journalism only. Nothing here is advice, a signal, or a recommendation to buy, sell, or hold anything.
Educational and data-journalism content only. Not financial product advice. We do not know your objectives, situation or needs, and nothing here is a recommendation to buy, sell or hold any financial product. Do your own research; consider licensed advice.