 The Refutation
The graveyard · The autopsy
Supertrend, flipped to death: the most-taught indicator on the internet
If you learned to trade from YouTube, you probably learned the Supertrend. It topped our folklore hunt being the single most-taught beginner tool on the internet, complete with the green-line/red-line screenshots and the promise that the trend will tell you when to start riding the new trend. So we did the honest thing: we tested it exactly the way it's taught.
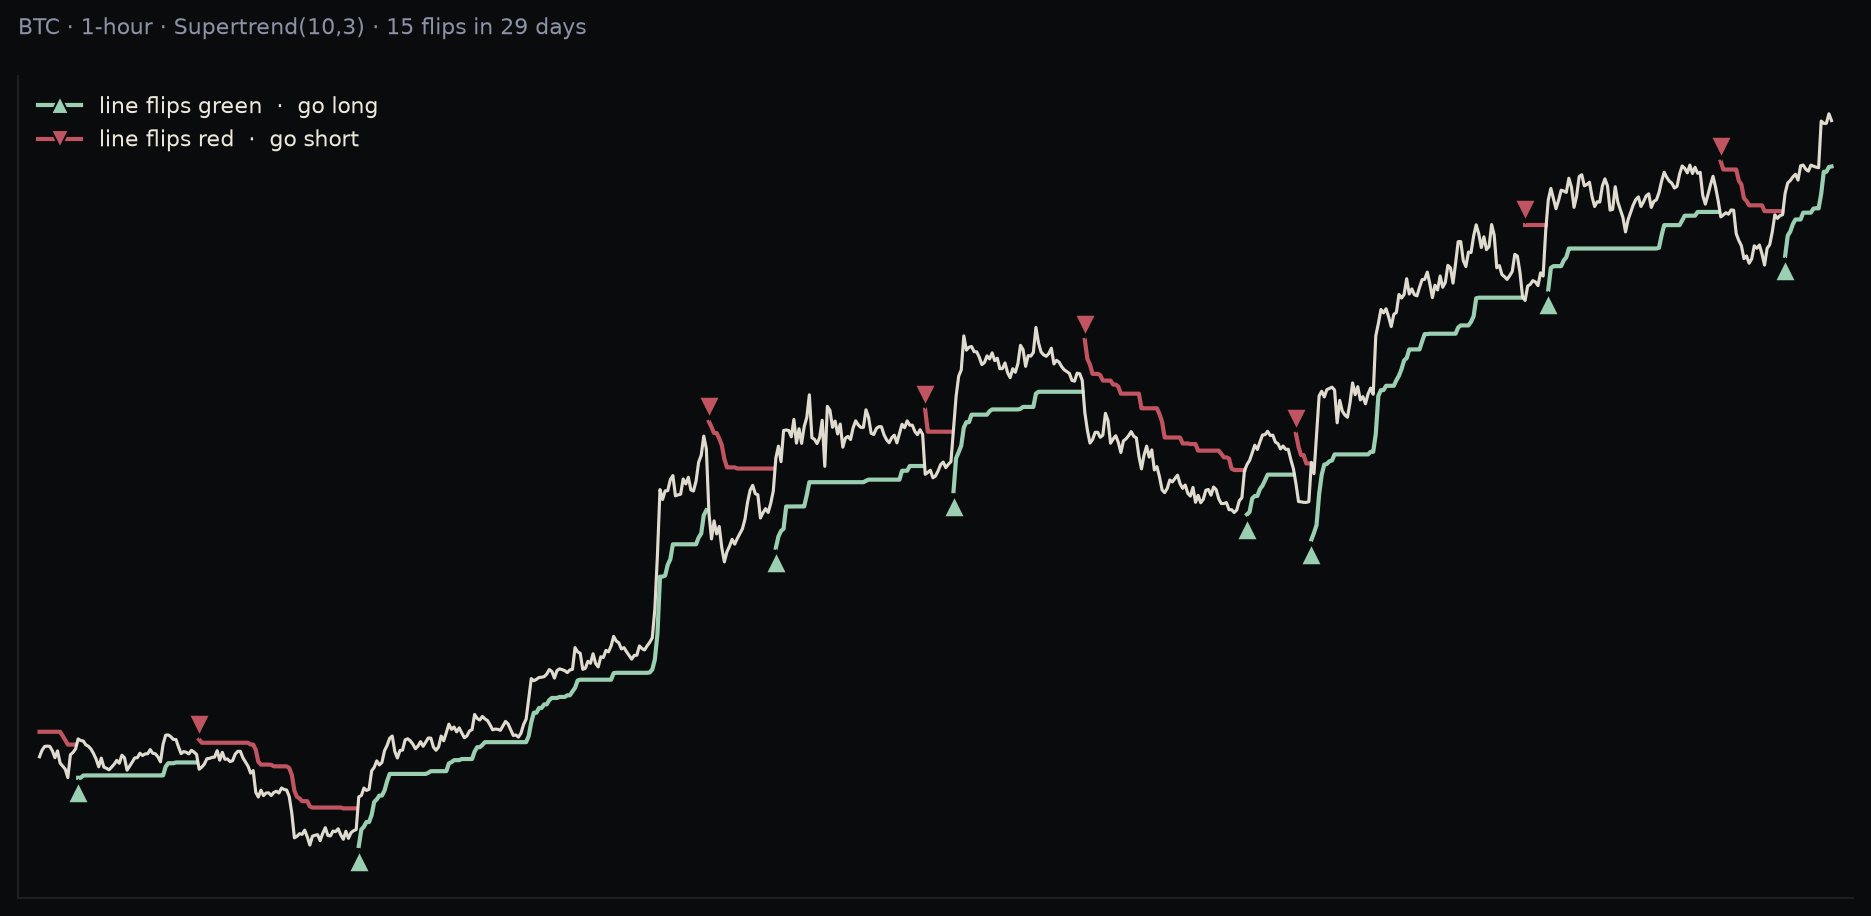
Figure 1 is the tool itself, on a month of Bitcoin. The line tracks below price while the trend is judged up and jumps above it when the trend is judged down, changing colour as it goes. Each flip is a signal: green means close the short and go long, red means the reverse. You are never out of the market. Note how many times it changes its mind inside a single month, and that this is a month price spent mostly going up.
The method
We ran Supertrend(10,3) — the canonical settings everyone teaches — on BTC 1-hour data, traded the textbook way: always in the market, flip long-to-short on every signal. No discretion, no filter, no "wait for confirmation." That's the pitch: the indicator keeps you on the right side of the trend.
Entries filled at the next bar's open (no look-ahead), fees netted, one position at a time and all the rest. Nothing exotic, just reliable, honest data of over 1,200 flips.
What the data actually showed
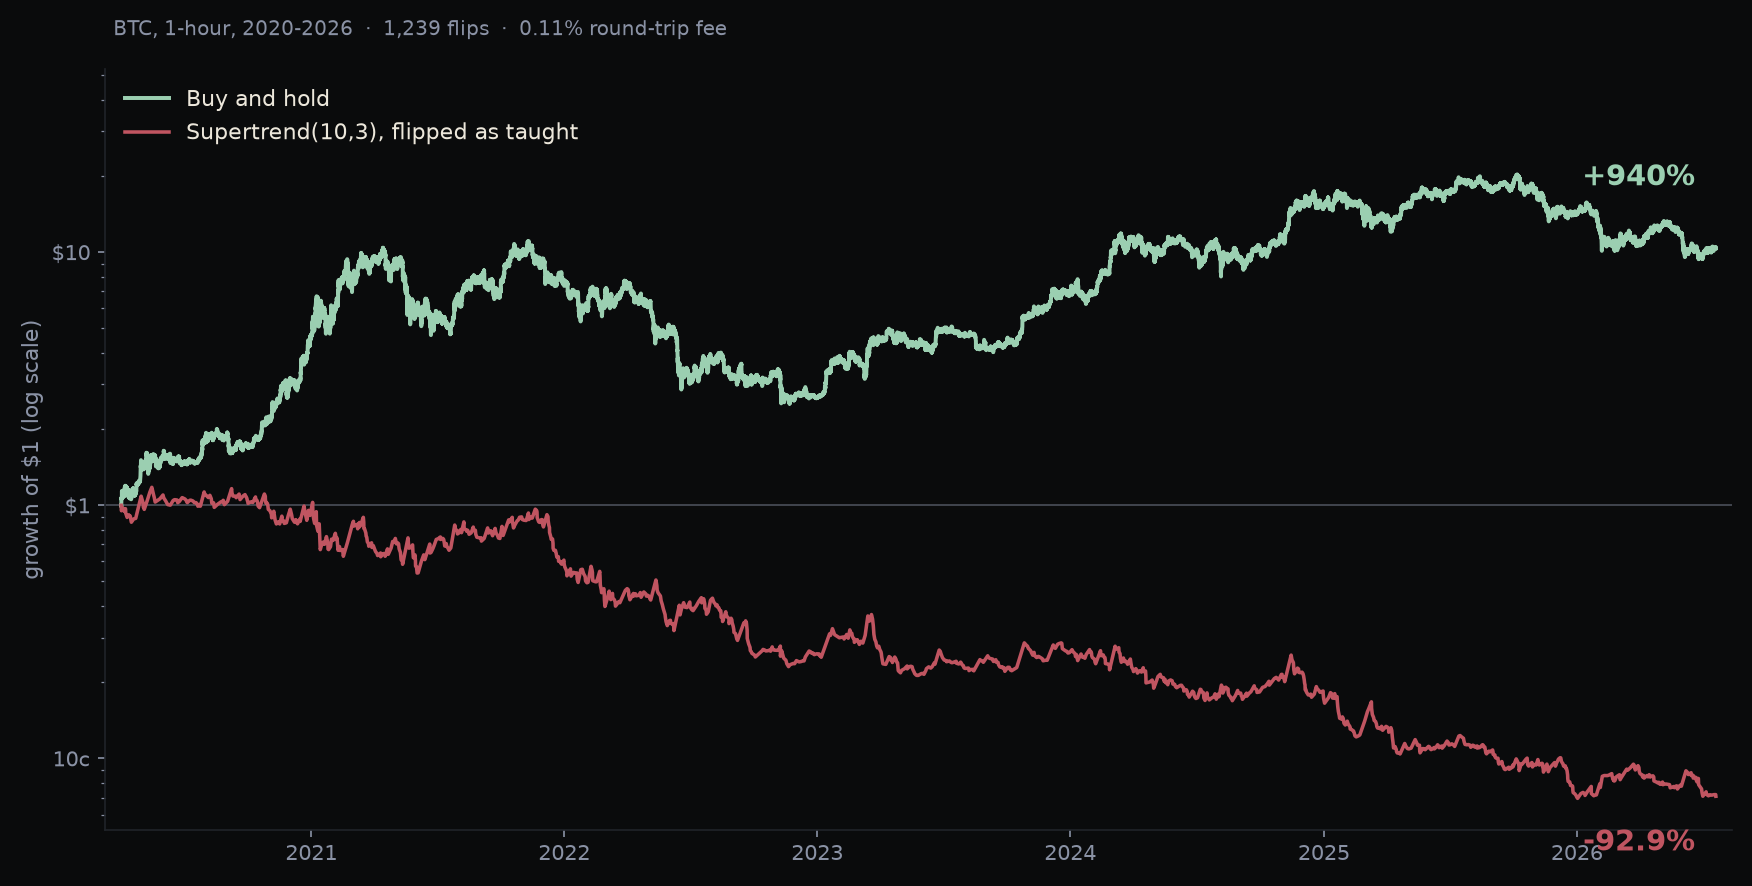
It lost 92.9%.
In the same window, buying and holding gained 940%.
The opportunity cost makes the loss look manageable. A tool sold as a trend-follower, run across one of the largest trends in the asset's history, converted a ten-bagger into near-total loss. It didn't just underperform buy-and-hold, it inverted it.
Figure 2 is the whole article in one picture. Both lines start at the same dollar on the same day and run on the same prices; the only difference is that one of them followed the indicator. The green line is 'buy and hold' and the red line is the standard 'Supertrend', going both long and short.
The obvious objection: "a few bad trades wrecked it." Not this time, this is where the graveyard gets interesting.
- Strip the best 5 trades: −97.8%. Take away the winners and it's worse — nearly total loss.
- Strip the worst 5 trades: still −87.5%. Take away the disasters and it's still dead.
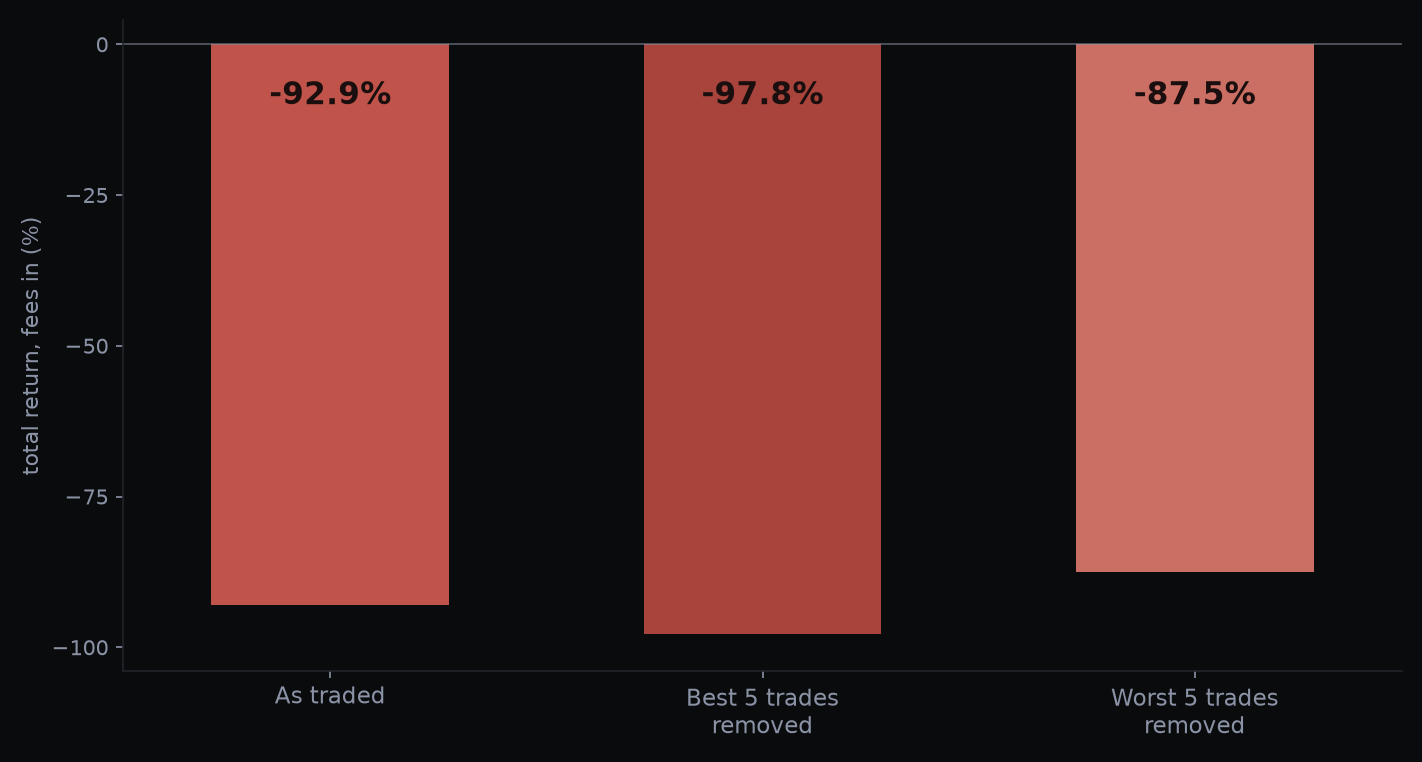
That's a convex, structurally negative distribution. The result isn't carried by a handful of outliers in either direction, it's the middle of the distribution bleeding out. Every flip pays the 0.11% round-trip exchange fee, and 1,239 flips means you're feeding the fee wall over a thousand times. A strategy that trades this often needs a real per-trade edge just to break even. It has the opposite.
So is it the fee-wall or the lack of signal that's killing the Supertrend? Before fees, the average flip returned −0.024%; after the 0.11% fee it returned −0.134%. The fee is 82% of the bleed. Strip the fees out entirely and the strategy still ends down 72%, so the signal is mildly negative on its own, but it's the churn and turn that makes "mildly negative" into "disaster territory".
Then we replaced the indicator with a coin flip. Same 1,239 moments, same holding periods, same fee, and only the direction randomised, five thousand times over and Figure 4 is where those coins landed.
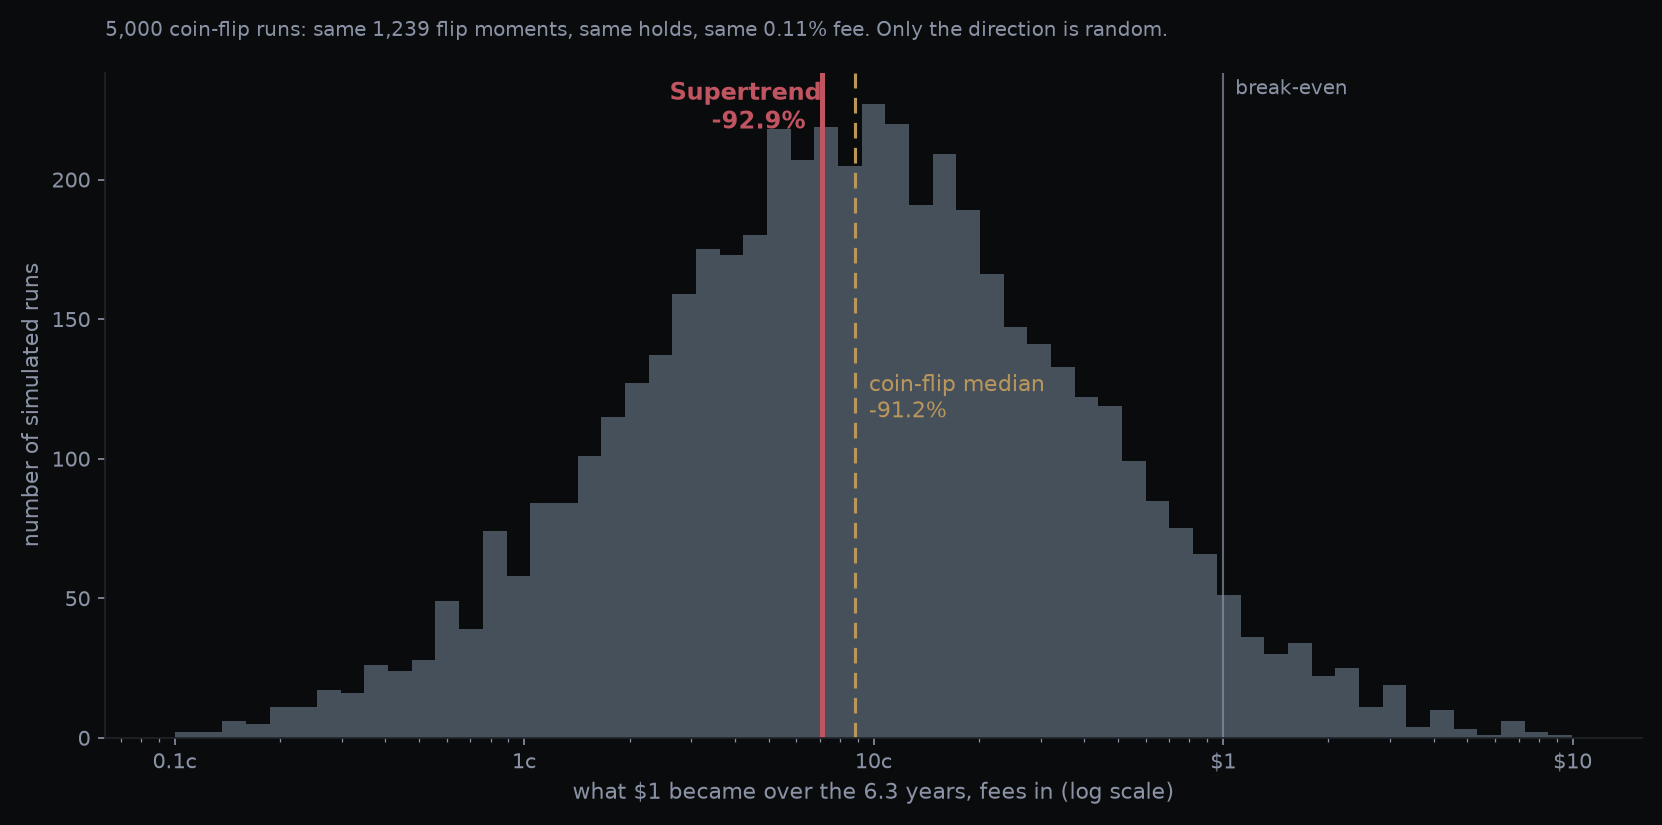
The coinflip had a median of −91.2% overall return after 6.3 years while the Supertrend returned −92.9%. Nearly 44% of the random runs beat it, which is another way of saying it's interchangeable with random runs. Note what the shape says on its own: almost the entire distribution sits left of break-even. At this trading frequency the fee alone is close to a death sentence, no matter which way you steer it.
"But it works on the 4h." We hear this constantly, so we checked. Yes, Supertrend(10,3) looks profitable on the 4-hour chart: on Bitcoin it turned $1 into $3.38. The trouble is what the same dollar did sitting in BTC unlevered. Figure 5 puts every timeframe and asset side by side.
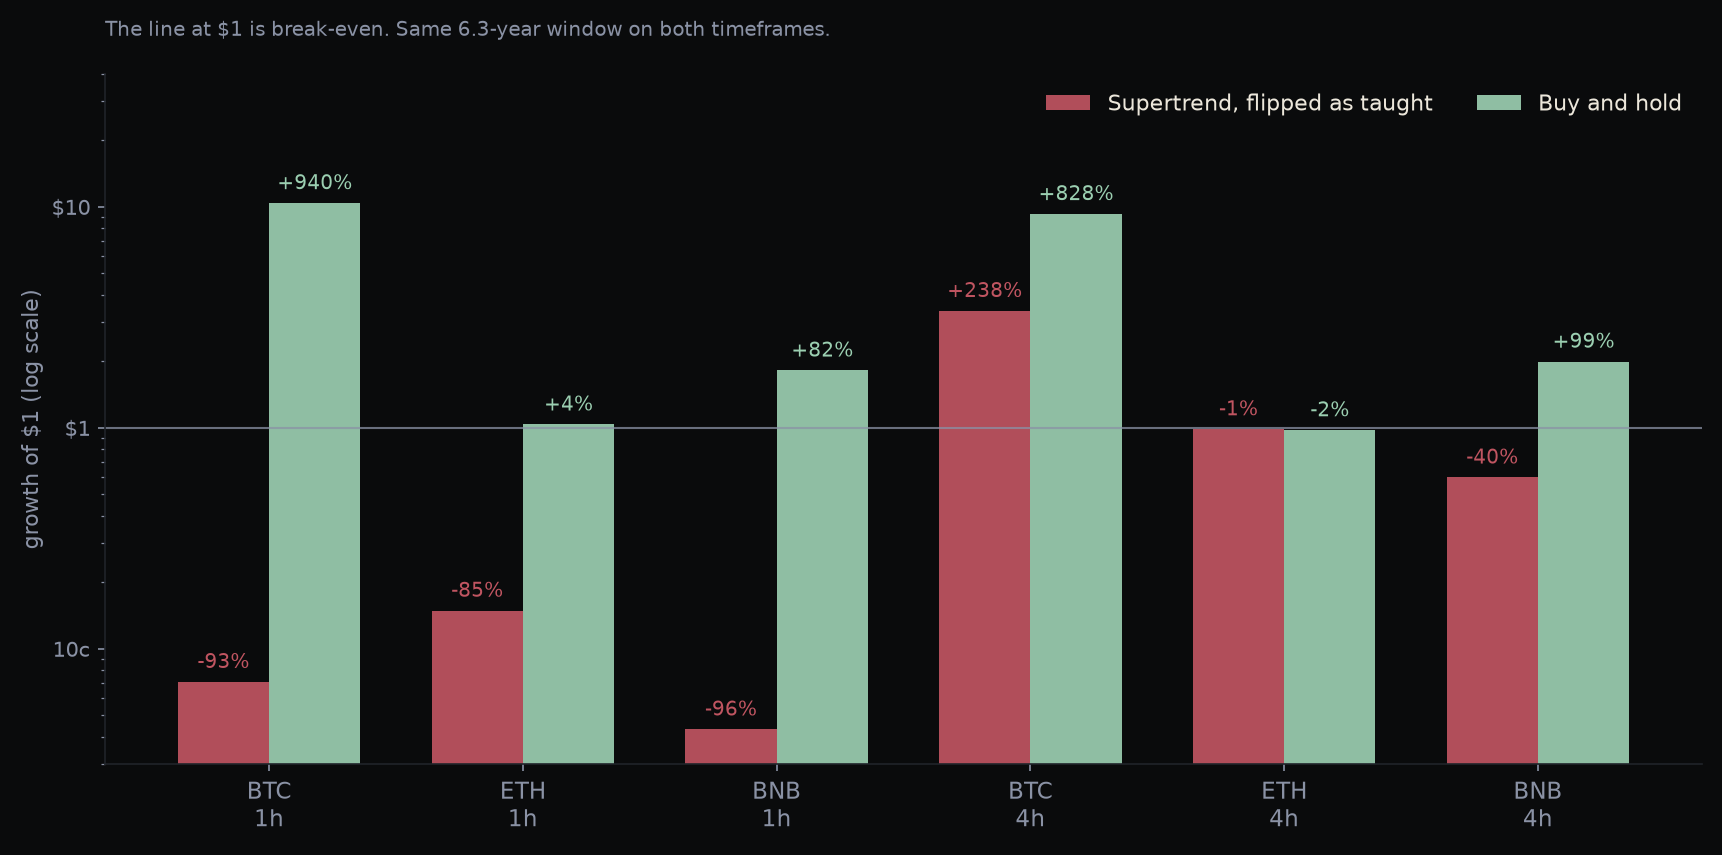
The 4-hour version is profitable on Bitcoin and still loses to the couch by a distance: +238% against +828% for holding. It trails buy-and-hold in five of the six cells, and the sixth is a dead heat in a flat market (ETH, −1.4% against −2.4%). Slowing the indicator down doesn't find an edge; it just churns less of your money away, so more of the market's own drift survives.
And when we tested the entries directly against random entries at every hold length, the 4-hour long signals were worse than random every single time, by −0.37 to −1.52 percentage points. So the 4h "edge" is drift: you make money by being long while the thing goes up, not because the signal picked the moment. A coin picking the same number of entries did the job better.
That's the tell for an entire class of mirages. If your "signal" can't beat a random entry at the same hold, you don't have a signal. You have exposure with extra steps and extra fees.
Why it's taught anyway
Two reasons, and neither is because it works.
First, it's visually convincing on a hindsight chart. Pull up any big trend, overlay Supertrend, and the line hugs the move beautifully — because you're looking at the periods where it happened to be right, on a chart where the trend already resolved. That's in-sample fitting done by your own eyeballs.
Secondly, it flips constantly, which feels like activity, 'stuff is happening so it must be working' logic, but the constant haemorrhaging of capital through fees and small flips is enough to bleed an account over 90% in six years.
The honest takeaway
The well-renowned Supertrend(10,3), traded as taught, wasn't a weak edge or a mediocre one. It was a slow and reliable wealth-transfer away from the account holder, in a window where the passive alternative multiplied capital tenfold. And it stayed dead when we removed its best trades, removed its worst trades, and when we benchmarked its entries against random noise.
None of this is advice on what to trade or avoid, it's a look at what the evidence says about a specific, popular configuration on specific data. A rigorous, data-driven approach to invalidating the strategies we're all taught. At The Refutation, we don't like what's popular, or what's trending, we like what works, and we like the truth. Strategies that survive the same gauntlet you just watched this one fail. Different settings, assets, or a genuine regime-aware overlay (member methodology) can change the picture; we test those separately and hold them to the same bar.
But the headline result deserves to be blunt: the most-taught beginner indicator on the internet, run by its own instruction manual, failed our simplest tests decisively. The lesson isn't "Supertrend is uniquely bad." It's that taught ≠ tested. Popularity is a measure of how well something screenshots, not how it fills.
We publish the graveyard so the survivors mean something. This one goes in the ground, but you can see the survivors here.
— The Refutation. Education and data-journalism on method and evidence. Not signals, not advice.
Educational and data-journalism content only. Not financial product advice. We do not know your objectives, situation or needs, and nothing here is a recommendation to buy, sell or hold any financial product. Do your own research; consider licensed advice.